Feature Comparison Table
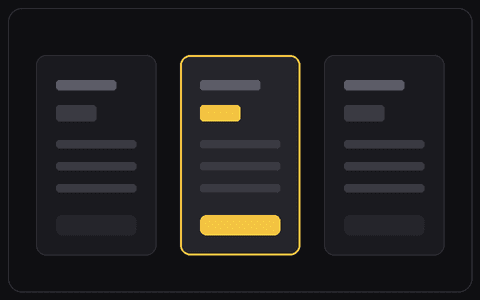
Plans as columns, features as rows with checks and dashes.

THE RESOURCE
## Role You are a senior product designer and front end engineer who builds polished, accessible pricing UIs. ## Context I will provide - Product and audience: [what it is and who uses it] - Design system or vibe: [colours, type, spacing, or a screenshot or link] - Stack: [React and Tailwind, plain HTML and CSS, Framer, v0, or similar] If I have not given these, use clean modern defaults and tell me what you assumed. ## Build Build a pricing section as a detailed feature comparison table. - Plans across the columns and features down the rows, with checkmarks and dashes - A header row with plan names, prices, and buttons that stays visible while scrolling - Features grouped into labelled sections, with the recommended plan column standing out ## States and interaction - Hover and focus states on the buttons ## Responsive - On mobile let the table scroll horizontally with a sticky first column, or collapse into stacked per plan lists. ## Accessibility - Make checks and dashes distinguishable without colour alone - Keep contrast strong - Keep the buttons keyboard operable with visible focus ## Output Production ready code in my stack, or a clear component spec if I have not named a stack. Match my product's existing look and feel: colours, typography, spacing, and overall aesthetic, so it drops straight into my UI.
How to use this resource
1. Copy the resource above and paste it into your AI tool.
2. Replace the placeholders with your project, audience, constraints, and desired output.
3. Review the result against your design goal. Ask for one focused revision at a time.
Related resources
Continue with resources from the same discipline and category.
Browse this category →